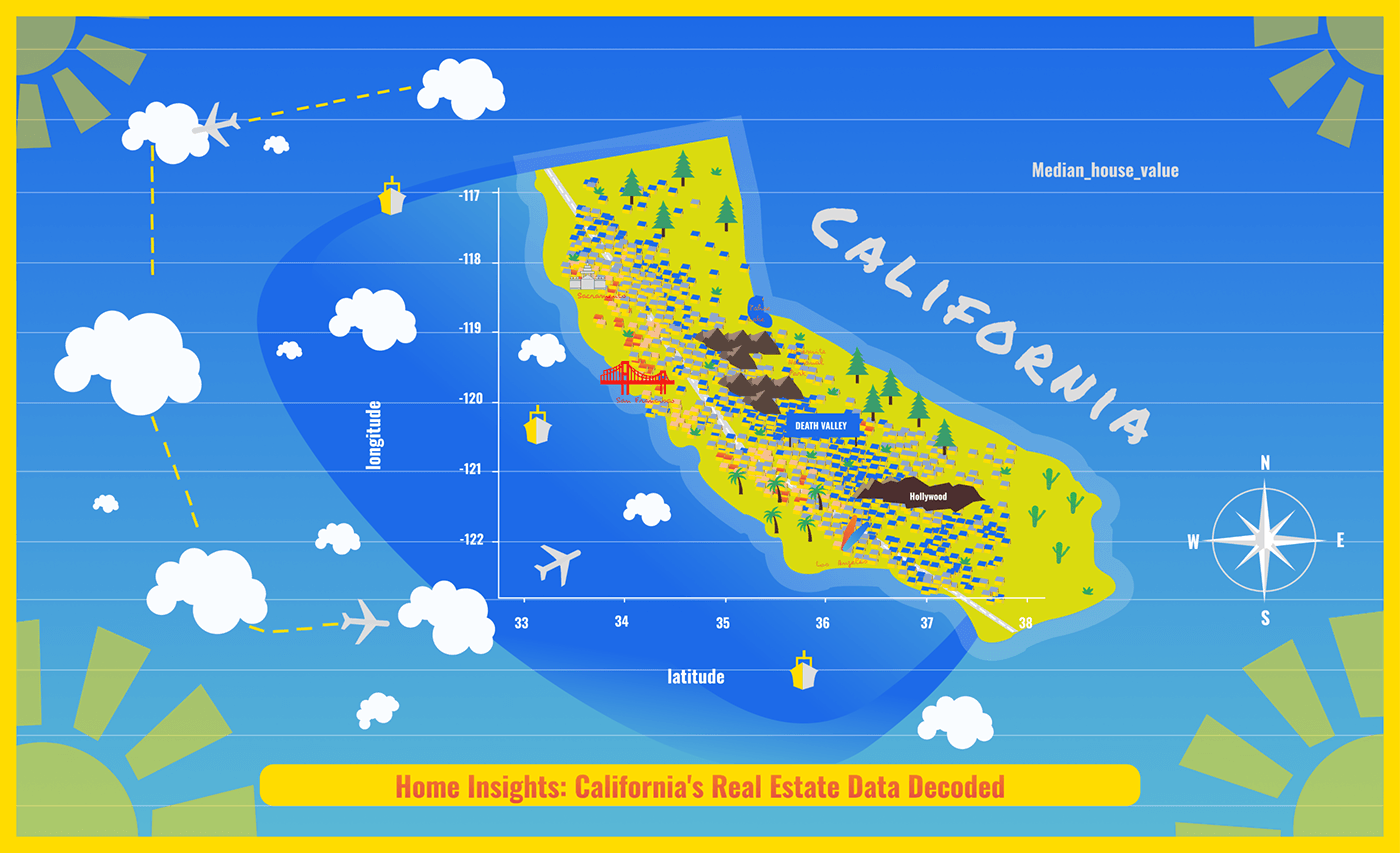

Excited 😎 to share my recent project! As part of a course for Artificial Intelligence , I embarked on creating an informative infographic using data from the Open Data Portal. The challenge was to turn that data into a clear and engaging visualization, and to do so, I employed Python as a key tool in the data analysis and design of the infographic.
Python proved to be a powerful option thanks to its versatility and the numerous libraries available to manipulate and visualize data. Using pandas for data manipulation and matplotlib/seaborn for visualization, I was able to extract meaningful information and represent it effectively in the infographic.
This project not only allowed me to apply my programming and data analysis skills, but also taught me the importance of data visualization to effectively communicate information. I am excited about continued learning and look forward to continuing to explore new tools and techniques to improve my skills in this field.
If you are interested in learning more details about this project or discussing opportunities related to data analytics and visualization, feel free to contact me!
#Python #DataAnalysis #DataVisualization #Infographics #ContinuousLearning
Thanks for watching!!!

